What spatial analysis is
A GIS is layers, and that is the whole idea
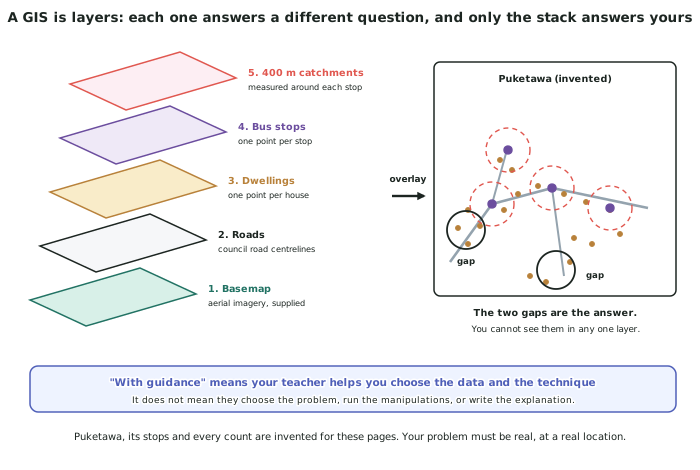
- A geographic information system stores each kind of thing as its own layer, and each layer knows where its features are on the ground.
- A layer is a dataset with coordinates attached. Roads are one layer, dwellings another, bus stops another. Each can be shown, hidden, styled or queried on its own.
- The analysis happens when layers are put together. No single layer answers a real question; the answer appears in the relationship between two or more of them.
- In the invented Puketawa problem, no layer says where a bus stop is missing. The basemap does not, the dwellings do not, the stops do not. The gap only becomes visible once the catchments are drawn around the stops and the dwellings are shown underneath.
The three verbs the standard assesses
- Collect. Get spatial data — data with a location attached. Two routes are allowed: fieldwork you do yourself with a spatial component, or accessing spatial data from other sources, such as council open data, LINZ layers or Stats NZ boundaries.
- Manipulate. Do something to the data that produces information it did not already contain. The standard names seven manipulations and the list is closed.
- Present. Produce a layout. The standard defines a layout as a map, which may also include tables, graphs and images. The map is compulsory; everything else is optional.
- All three are assessed, so a beautiful map built from one layer with no manipulation does not meet the standard, and neither does a clever query presented as a paragraph.
What "with guidance" means, and what it does not
- The standard defines it: your teacher guides the type and selection of data, and the manipulation technique.
- So your teacher can: tell you which layers exist and which are worth using, show you how to run a buffer or a query, and steer you off a technique that will not answer your question.
- Your teacher cannot do for you: choose the problem, decide what the result means, or write the explanation. Those are what is being assessed.
- At Level 3 this changes, and it is worth knowing now: AS91433 says with consultation, meaning the student initiates the discussion about which technique to use. The support available shrinks as the level rises.
What the software has to be able to do
- Any tool that stores layers with coordinates and can measure, select and style them will do. The standard names no product, and the marks are for the analysis, not the software.
- The functions you need are the seven manipulations, so check your tool can measure a distance or buffer, layer datasets, change symbols by value, sort and edit an attribute table, run a selection by rule, set a coordinate system, and chart a selection.
- A drawing program is not a GIS. If the software does not know where features are on the ground, you cannot measure, query or overlay — which removes most of the list.
- Keep every step you take. Screenshots of each manipulation, with a one-line caption, are the evidence that they happened.
Why this standard exists
- Spatial analysis answers questions that cannot be answered by looking. Which houses are more than a 400 m walk from a bus stop? is unanswerable by eye and trivial once the data is layered.
- It makes reasoning visible and checkable. Anyone can re-run your query and get your number, which is not true of an argument written in prose.
- It exposes assumptions. Choosing 400 m rather than 500 m, or straight-line distance rather than distance along streets, changes the answer — and being forced to choose makes the assumption explicit instead of hidden.
- That is why the standard requires a real problem. A simulated problem has no consequences, so no assumption ever has to be defended.
Worked Example
Worked example
Four students describe what they plan to hand in for AS91247. Decide which meet the standard, and fix the ones that do not.
- A: A map of my town with the roads, parks and schools layers turned on, coloured nicely, with a key and a scale bar.
- B: A study of which parts of the invented town of Puketawa are more than a 400 m walk from a bus stop, and where two new stops should go.
- C: A report with three graphs showing how bus use has changed, and a table of stop locations.
- D: A plan for where to put bus stops in a made-up town I designed.
Answer:
Step 1 — check for a real problem at a real location.
D fails immediately. The standard says the problem cannot be a simulation. A designed town is a simulation, however carefully built. Fix: apply the same question to a real town with real council data — the technique carries over unchanged, and only the source of the layers has to change.
Step 2 — check that a manipulation produces new information.
A fails. Every layer shown was already in the data, so nothing has been produced. There is no question, so there can be no solution. Fix: attach a question the layers cannot answer on their own — which homes are more than 800 m from a park? — then measure, overlay and query. The same layers now support an analysis.
Step 3 — check that the presentation includes a map.
C fails. Graphs and a table are allowed in addition to a map, not instead of one. The standard defines the layout as a map. Fix: map the stops and style them by usage; the graphs then become supporting evidence rather than the whole submission.
Step 4 — confirm the one that passes.
B passes all three tests. The problem is real and located; the catchments and the gaps are produced by measuring and overlaying rather than being present in any input layer; and the output is a map, which the tables and graphs support.