What an urban pattern is
The definition, word by word
- An urban pattern is the spatial and/or temporal variation created in a city. Every word in that sentence is doing work, and three of them decide whether your topic is valid.
- Urban means it happens in a city. A pattern of dairy farm size across the Waikato is a geographic pattern, but it is not an urban one, so it cannot be used for this standard.
- Pattern means a definite arrangement — something you could state in one sentence and someone else could check. Shops are found in various places is not an arrangement. Retail floorspace is concentrated in three places: the CBD, two malls and one big-box strip, all of them on or inside the ring road is.
- Variation is the part students skip. A pattern with no variation in it is a list of locations. You need something that differs measurably from place to place, or from time to time, or both.
- Created points at the second half of the standard: something made the pattern, and explaining what made it is worth more than describing it.
The six patterns the standard names
- Crime — offence rates or types by suburb, or by time of day, week or year.
- Transport networks — how well different parts of the city are served by road, rail, bus, cycleway and ferry.
- Education networks — where schools are, their zones, their rolls, and how far students travel.
- Gentrification — higher-income residents moving into a lower-income inner suburb, and what changes as they arrive.
- Urban sprawl — the outward spread of the built-up area onto the city's edge.
- Retail development — where shops are, how big they are, and how that has shifted.
- The list is illustrative, not closed. Housing affordability, green space and industrial land all work. Check your topic with your teacher first: a topic that cannot be measured cannot be described in detail, and one with no variation cannot reach Merit.
Spatial variation, temporal variation, and why the best topics have both
- Spatial variation is difference across the map. Between the centre and the edge, between one suburb and another, between one side of a motorway and the other.
- Temporal variation is difference across the calendar. Between 1985 and 2025, between summer and winter, between 9 a.m. and midnight.
- The standard says spatial and/or temporal, so one alone is enough to pass — but the strongest submissions use both, because the time dimension is usually where the explanation lives. A shop that closed is a fact; the year it closed points at the mall that opened the year before.
- A worked pairing, from the invented city of Tawharau: retail floorspace is concentrated in three places (spatial), and the CBD's share of it fell from 68 per cent in 1985 to 35 per cent in 2025 (temporal). Neither statement is interesting alone. Together they say the city grew new centres rather than a bigger old one.
Three models, and what they are actually for
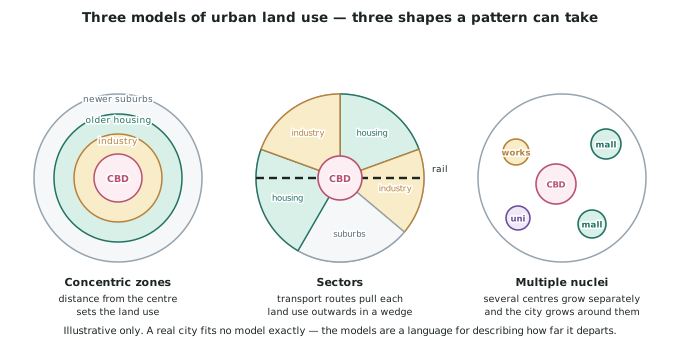
- The concentric zone model says land use is set by distance from the centre: a CBD, then industry, then older housing, then newer suburbs, in rings.
- The sector model says transport routes pull each land use outwards, so the zones are wedges rather than rings — industry along the rail line, housing on the ridge.
- The multiple nuclei model says a city grows several separate centres — a mall, a university, a port, an industrial area — and fills in around them.
- No real city fits any of them, and that is the point. The models are a language for saying how far your city departs from a simple shape, which is exactly what describing variation needs.
- Use a model as a sentence, not a section. Tawharau's retail is closest to multiple nuclei, but every nucleus is on the ring road, so accessibility rather than history put them there. That describes, applies a model and starts an explanation at once.
What you have to hand in
- The task is set by your school — a report, a presentation, an annotated map set or structured answers. The standard does not specify a format.
- What the standard does specify is four things your submission must contain: a description of the pattern, an explanation of the factors that created it, case study evidence, and a geographic concept.
- Field data is normally expected, and a pattern you counted yourself is far easier to describe in detail than one you read about. Secondary data — census, council reports, crime statistics — is allowed, but must be specific and referenced, not remembered.
- Keep a running evidence sheet, one line per fact with its source and date. Twenty solid lines are enough for this standard.
Worked Example
Worked example
A class is choosing topics for AS91241. Four students propose these. Decide which are valid urban patterns, and fix the ones that are not.
- A: Why New Zealand cities are growing.
- B: Traffic congestion on Tawharau's ring road.
- C: Reported burglaries per 1,000 households in each of Tawharau's 14 suburbs, 2020 to 2025.
- D: Rubbish in Tawharau.
Answer:
Step 1 — apply the three tests: urban, measurable, varying.
A fails at the widest possible scale. It is about cities in general, not variation in a city, and no map could show it. Reject.
B is urban and measurable, but has no variation — congestion on one road is one place. Fix it: Average travel time per kilometre at four points around the ring road, at three times of day, which adds spatial variation (four points) and temporal variation (three times).
C passes all three tests as written. One city, a rate rather than a raw count, 14 places and six years. Accept.
D fails the measurable test, because rubbish is not a variable. Fix it: Items of litter counted in a 100 m transect at the centre of each of eight suburban shopping strips.
Step 2 — check the fixed topics can be explained, not just described.
Fixed B can be explained by land use, on-ramp locations and the school day; fixed D by bin provision, foot traffic and cleaning contracts. A topic you can measure but not explain will stall inside Achieved, so run this check before collecting anything.