How the pattern changes over time
Temporal variation is half the standard
- The definition says spatial and/or temporal variation, so a pattern described only in space has used half of what is available.
- Temporal variation is any measured difference between two or more dates, at any timescale — forty years, one year, one week, one day.
- Short timescales count. Crime by hour, bus loadings by day of the week and shop occupancy by season are all temporal variation, and all are collectable in a fortnight.
- Temporal variation is usually where the explanation is, because a change has a date, and a date points at what happened just before it.
- You need at least two dates. One snapshot cannot show a change, however detailed it is.
Reading a pattern at three dates
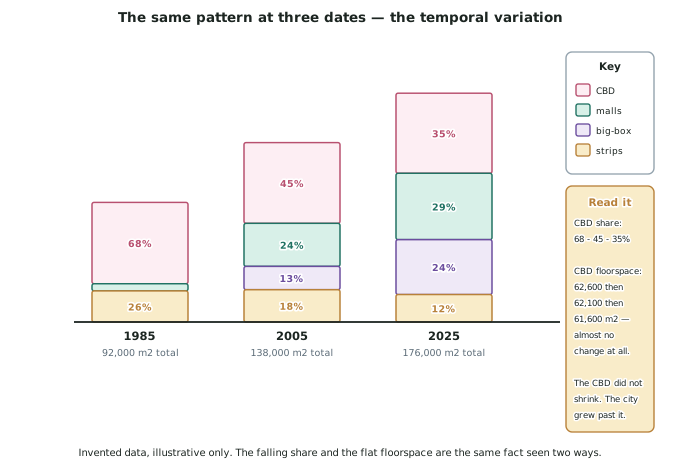
- Read the shares and the totals separately, because they can move in opposite directions and usually do.
- In Tawharau the CBD's share of retail floorspace falls from 68 per cent to 35 per cent, which looks like collapse. Its own floorspace goes from about 62,600 m2 to 61,600 m2 — a fall of under 2 per cent in forty years.
- Both are true and they describe different things. The share fell because the city total nearly doubled, from 92,000 to 176,000 m2. The CBD did not shrink; the city grew past it.
- This is the commonest misreading in the standard, and not only in retail: a suburb's share of crime, of enrolments or of new dwellings can all fall while the number rises.
The urban processes that produce temporal change
- Suburbanisation — people and activity moving from the inner city to the outer suburbs. Evidence: population by suburb at two censuses.
- Urban sprawl — the outward spread of the built-up edge, usually at low density. Evidence: area in hectares at two dates, plus dwellings per hectare in the new areas.
- Decentralisation — activity moving out of the centre while the centre stays put. Evidence: the centre's share of jobs, floorspace or enrolments at two dates.
- Gentrification — higher-income households moving into a lower-income inner suburb, with rising rents, changed shops and displaced residents. Evidence: median rent, business mix, and who has left.
- Intensification — more dwellings on the same land. Evidence: dwellings per hectare at two dates in one suburb.
- Urban renewal — deliberate redevelopment of a run-down area. Evidence: the plan, its date, and what has been built since.
- Name the process, then prove it with two dates. A named process without two measurements is a label, and labels earn Achieved at best.
Rates: the detail that lifts a temporal description
- A change with no rate attached is not described in detail. The suburb has gentrified is a label; median weekly rent in Rakoia rose from $310 in 2015 to $520 in 2025, about 68 per cent, against 41 per cent citywide is a description.
- Always compare the rate to something — the citywide rate, or a neighbouring suburb. A rate alone means little.
- Rates are rarely steady, and the unsteady part is the interesting part. If most of a forty-year change happened in six years, the explanation lives in those six years.
- Convert to annual figures when comparing unequal periods.
- Say what has not changed as well. Tawharau's CBD floorspace barely moved for forty years, and that non-change is one of the most informative numbers in the study.
Events, and how to date a change properly
- Find the date of the change in the data first, then look for what happened just before it. Picking an event and assuming it caused things is how students end up asserting causes.
- A convincing dating has three parts: the change is visible in the data, the event precedes it, and a mechanism links them.
- Worked dating, in the invented Tawharau: Rakoia Street had eleven occupied shops in 2011, Kowhai Mall extended in 2013, and six shops were empty by 2019. The order fits the mall causing the closures — but the strips nearest the mall lost almost nothing, which that cause does not predict. The dating survives; the causal claim does not.
- Beware the change already under way. If the trend was moving before the event, the event at most accelerated it, and saying so is more accurate than claiming it started it.
Worked Example
Worked example
A student is studying gentrification in Rakoia, an inner suburb of the invented city of Tawharau, and has collected this data. All figures are invented for this example.
| Indicator | 2005 | 2015 | 2025 |
|---|---|---|---|
| Median weekly rent | $240 | $310 | $520 |
| Dwellings per hectare | 14 | 19 | 26 |
| Households in the lowest income quartile | 61% | 52% | 29% |
| Cafés and restaurants | 2 | 5 | 14 |
| Convenience shops (dairies, laundromats, repair) | 11 | 9 | 5 |
Describe the temporal variation in detail and explain what it shows.
Answer:
Step 1 — get the rates, not just the changes.
Rent rose 29 per cent from 2005 to 2015, then 68 per cent from 2015 to 2025. The second decade changed more than twice as fast as the first, so this is not a steady trend and should not be described as one.
Step 2 — find where the acceleration is, in every indicator.
Dwellings per hectare rose 5 then 7; the lowest income quartile fell 9 points then 23; cafés rose by 3 then by 9. Every indicator accelerates in the same decade, which is far stronger evidence than any single one, because five measures do not usually turn together by chance.
Step 3 — describe the substitution, not just the two lists.
Cafés rose from 2 to 14 while convenience shops fell from 11 to 5. The total number of businesses barely moved — 13 then 19 — so the street did not empty. It changed clientele. That distinction is the difference between describing decline and describing gentrification, and they are not the same process at all.
Step 4 — say who left, because gentrification is defined by displacement.
The lowest income quartile fell from 61 to 29 per cent of households while dwelling numbers rose. So the loss is not because there are fewer homes; there are more homes and fewer low-income people in them. Where those households went is the part most submissions omit.
Step 5 — put a date on the turn and look just before it.
The acceleration begins in the 2015 to 2025 decade. The invented council's Rakoia Regeneration Plan was adopted in 2014, and the Kowhai Road busway opened in 2016, cutting the trip to the CBD from 22 minutes to 9. Both precede the acceleration, and both have mechanisms — the plan permitted taller buildings, the busway made the suburb accessible without a car.
Step 6 — state what the data cannot settle.
The two events are two years apart and the data is decadal, so this data set cannot separate their effects. Saying so is stronger than choosing one at random.