Processing data: percentages, indexes and real values
What "processing" means
- The Achieved criterion says "processing and presenting statistical data ... to show trends".
- Processing means doing something to the raw numbers so a trend becomes visible: converting to percentages, building an index, adjusting for inflation or population, or calculating a change.
- Copying a Stats NZ table into your report is not processing. You must transform it.
Percentage change
- Converts levels into rates of change, which is what most economic trends are about.
- Always say what period the percentage covers — over a quarter, or over a year.
Percentage change versus percentage point change
- If unemployment goes from 4.0% to 5.0%, that is a rise of 1.0 percentage point, and a 25% increase in the rate.
- Both are correct; they mean different things. Say which one you are using.
Index numbers
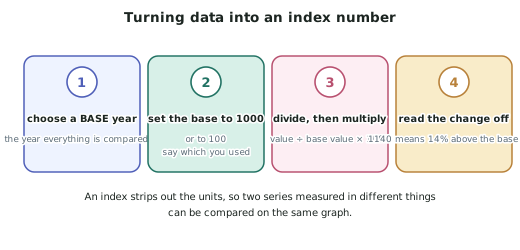
- An index rescales a series so every value is compared to a base period, which is set to 100 or 1000.
Why indexes are useful here
- They strip out the units, so two series measured in different things — dollars and people, say — can be plotted on the same graph and compared directly.
- That is exactly what the inter-relationship section needs.
Real values
- Converting a nominal series to a real one removes the effect of price changes:
- Use it for GDP, wages, incomes and government spending — any series measured in dollars over time.
- Approximation for rates of change:
Per capita values
- Essential when population is changing. Real GDP can rise 2% while population rises 3%, so real GDP per capita falls — the average person is worse off even though the economy grew.
- Any comparison over a long period, or between regions of different sizes, should be per capita.
Averages and moving averages
- A moving average smooths a volatile series so the underlying trend shows through.
- A four-quarter moving average averages each quarter with the three before it, which removes most seasonal noise.
- Useful when the raw series jumps around so much that the trend cannot be seen.
Which processing method for which job
| You want to… | Use |
|---|---|
| Show how fast something is changing | Percentage change |
| Compare two series measured in different units | Index numbers |
| Remove the effect of inflation | Real values |
| Account for a changing population | Per capita |
| See through a volatile or seasonal series | Moving average |
Worked ExampleProcessing a series four ways
An economy publishes the following. All figures are invented, for method only.
| Year | Nominal GDP ($bn) | Price index (base Year 1 = 1000) | Population (millions) |
|---|---|---|---|
| Year 1 | 340 | 1000 | 5.00 |
| Year 2 | 366 | 1050 | 5.10 |
| Year 3 | 398 | 1120 | 5.22 |
(a) Calculate the annual percentage change in nominal GDP for each year. (b) Convert each year's GDP to real terms at Year 1 prices. (c) Calculate real GDP growth for each year. (d) Calculate real GDP per capita for each year, and comment.
Step 1 — (a) Nominal percentage change
Nominal GDP is growing, and accelerating. On its own this looks like a strong economy.
Step 2 — (b) Convert to real terms at Year 1 prices
- Year 1: it is the base year, so real = nominal = $340bn
- Year 2:
- Year 3:
Step 3 — (c) Real GDP growth
The picture reverses completely. Nominal growth accelerated from 7.6% to 8.7%; real growth slowed from 2.5% to 2.0%.
The whole of the apparent acceleration — and more — was inflation. The price index rose 5.0% in Year 2 and 6.7% in Year 3.
Step 4 — (d) Real GDP per capita
- Year 1:
- Year 2:
- Year 3:
Comment. Real GDP per capita rose slightly in Year 2 and fell in Year 3, from $68,353 to $68,085.
Population grew 2.4% in Year 3 while real GDP grew only 2.0%, so the economy was producing more in total but less per person. The average New Zealander's share of output fell.
Step 5 — What the three processing steps revealed
| Measure | Year 2 → Year 3 | What it says |
|---|---|---|
| Nominal GDP | +8.7% | Looks strong — but confounds price and quantity |
| Real GDP | +2.0% | Genuine growth, and slowing |
| Real GDP per capita | −0.4% | The average person is worse off |