Making a justified forecast — the Excellence criterion
The exact wording, because it decides the grade
Excellence: "making a justified forecast for one contemporary economic issue using extrapolated statistical data from both of the contemporary economic issues."
-
This is the most specific sentence in any Level 2 Economics standard. Read the three requirements it contains:
- The forecast is for ONE issue.
- It uses extrapolated data — you must project the trends forward.
- It uses data from BOTH issues.
-
A forecast for one issue built only from that issue's own data cannot reach Excellence, however carefully it is done. The second issue must be doing work in the forecast.
What "extrapolated" means
- Extrapolation is continuing an established trend beyond the last actual data point.
- On a graph, it is the dashed extension of the line past the final observation.
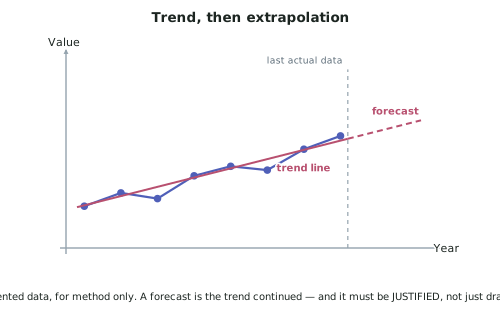
- Show it on the figure. Mark clearly where actual data ends and the forecast begins.
What "justified" means
- Not "here is a line I extended".
- A justified forecast explains why the trend should continue, using economic concepts and models, and states what the forecast depends on.
A justified forecast contains all five of these:
- The trend in issue 1, extrapolated, with numbers.
- The trend in issue 2, extrapolated, with numbers.
- The economic mechanism linking them — the inter-relationship you already established.
- The forecast itself — a specific figure or range, for a stated date.
- The assumptions and risks — what would have to hold for it to be right, and what would make it wrong.
The structure that works every time
Step 1. Real GDP growth has fallen from 3.5% to 1.2% over the past six quarters. Extrapolating this trend, growth is likely to be between 0.5% and 1.0% by the end of next year.
Step 2. Unemployment has risen from 3.4% to 4.6% over the same period, and its trend has been rising at roughly 0.3 percentage points per quarter.
Step 3. The two are linked by derived demand: firms hire because of what workers produce, so falling output reduces demand for labour. The data shows unemployment turning two to three quarters after growth, consistently.
Step 4. Because growth is forecast to remain weak, and because unemployment lags growth by two to three quarters, unemployment is forecast to reach between 5.0% and 5.4% by the end of next year.
Step 5. This assumes no change in the OCR, no major supply shock, and a stable participation rate. If the RBNZ cuts the OCR, AD would shift right and the forecast would be too high. If the participation rate falls as discouraged workers leave, the measured rate could be lower than forecast even if the labour market does not improve.
- Notice what step 4 does. The forecast is for unemployment (one issue), and it uses the extrapolated trend in growth (the other issue) to justify it. That is exactly what the criterion demands.
The limits of extrapolation — say them
- Trends do not continue forever. Business cycles turn.
- Extrapolation assumes nothing changes, and policy, shocks and behaviour do change.
- The further out you forecast, the less reliable it is. Forecast one year, not five.
- A forecast with a range is more honest than a single number, and shows you understand uncertainty.
Saying all this does not weaken your forecast — it is part of justifying it.
Worked ExampleA complete justified forecast
Your two issues are economic growth and unemployment. Write the Excellence forecast.
⚠️ All figures below are invented, for method only. Your report must use real Stats NZ data.
| Quarter | Real GDP growth (annual %) | Unemployment rate (%) |
|---|---|---|
| Q1 | 3.5 | 3.4 |
| Q2 | 3.1 | 3.5 |
| Q3 | 2.6 | 3.7 |
| Q4 | 2.0 | 4.0 |
| Q5 | 1.6 | 4.3 |
| Q6 | 1.2 | 4.6 |
Step 1 — Extrapolate issue 1: economic growth
Real GDP growth has fallen in every quarter, from 3.5% to 1.2% — a fall of 2.3 percentage points over five quarters, averaging about 0.46 points per quarter, though the falls are decelerating (0.4, 0.5, 0.6, 0.4, 0.4).
Extrapolating the trend forward four quarters, and allowing for the deceleration:
A range is used rather than a point estimate, because the rate of decline is not perfectly constant.
Step 2 — Extrapolate issue 2: unemployment
Unemployment has risen in every quarter, from 3.4% to 4.6% — 1.2 points over five quarters, and accelerating (0.1, 0.2, 0.3, 0.3, 0.3).
On its own trend, extrapolating four quarters at roughly 0.3 points per quarter:
This is the extrapolation, not yet the forecast. The criterion requires the other issue to be used as well.
Step 3 — State the mechanism linking them
The two are linked by derived demand: firms hire workers because of what those workers produce and sell. When real GDP growth falls, firms sell less and need fewer workers, so demand for labour shifts left from DL to DL1, lowering employment from Le to Le1 and raising unemployment.
On the AS/AD model, weaker AD lowers real GDP from Y to Y1, requiring less labour. On the PPF, the economy moves to a point inside its unchanged frontier.
The data confirms the lag: growth begins falling in Q1–Q2, and unemployment begins rising noticeably in Q3 — a lag of about two quarters. Firms cut hours and stop replacing leavers before making redundancies, which is why employment responds after output.
Step 4 — Combine both extrapolations into the forecast
This is the step that satisfies the criterion.
The growth extrapolation says output growth will keep falling to 0.0–0.8%. Because unemployment lags growth by about two quarters, the weak growth already observed in Q5 and Q6 has not yet fully shown up in the unemployment figures — it will arrive in Q7 and Q8. And the further projected fall in growth will push unemployment higher again in Q9 and Q10.
However, growth is forecast to remain positive, not negative. The economy is still expanding, just slowly, so firms are not facing the collapse in sales that would produce large-scale redundancies. That argues for unemployment rising, but decelerating toward the end of the period rather than continuing at 0.3 points per quarter.
The lower end reflects growth stabilising near 0.8%; the upper end reflects growth falling to zero.
Note that this is lower than the 5.8% that unemployment's own trend alone would predict — because the growth data indicates the economy is still expanding, which caps how far unemployment can climb. That adjustment is the second issue doing work in the forecast, which is exactly what the criterion requires.
Step 5 — State the assumptions and risks
This forecast assumes:
- No change in the OCR. If the RBNZ cuts, AD shifts right, growth recovers, and unemployment would be lower than forecast — though with a lag of a year or more, so the effect may fall outside the forecast period.
- No supply shock. A sharp rise in imported input costs would shift AS left, reducing real GDP further and pushing unemployment above the forecast range.
- A stable participation rate. If discouraged workers leave the labour force, the measured unemployment rate could come in below the forecast even if the labour market does not improve — because they leave both the numerator and the denominator. The underutilisation rate would be the check.
- No major fiscal change. A large increase in government spending would raise , shifting AD right.
The forecast is most reliable for Q7–Q8, where the growth data has already occurred and only the lagged labour market response remains. Q9–Q10 is less reliable, because it depends on the growth extrapolation itself being correct.