Processing data and presenting the trend
Showing the mathematical steps
- Merit requires evidence of the mathematical steps used to process the experimental data. A table of final concentrations with no working shown does not meet it.
- Show the full calculation for one sample, then tabulate the rest.
The sequence for a titration:
- 1. Mean of the concordant titres.
- 2. Moles of titrant: .
- 3. Moles of analyte, via the mole ratio.
- 4. Scale for the aliquot and any dilution.
- 5. Express in the units your trend needs — mol L−1, mg per 100 g, % by mass.
Presenting the data
- A results table with one row per value of the independent variable, showing:
- the independent variable,
- all titres, with the concordant set identified,
- the mean titre,
- the processed concentration.
- A graph of the processed quantity against the independent variable.
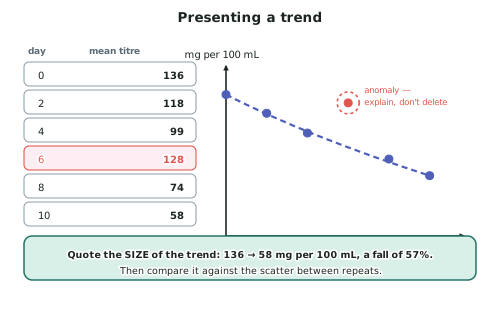
- Plot the independent variable on the x-axis and the measured quantity on the y-axis, label both axes with units, and use a sensible scale that fills the page.
- Draw a line or curve of best fit if the points support one — not a dot-to-dot.
Describing the trend
- Say what the relationship is, in terms of your own variables, not in generic language.
- Weak: "There is a trend."
- Better: "The concentration decreased over time."
- Strong: "The ascorbic acid concentration decreased from 0.0142 to 0.0061 mol L−1 over ten days, a fall of 57%, with the steepest decline in the first three days."
- Where a rate or gradient can be quoted, quote it — a number is stronger than a direction.
Handling anomalous results
- Report them. Deleting data is not permitted.
- Identify the anomaly, state that it was excluded from the trend, and give a reason based on what happened in the laboratory.
- "The day-6 result was 30% above the trend. The logbook records that this sample stood for 40 minutes before titration while the burette was refilled, during which time atmospheric oxidation of iodide would have generated additional iodine, giving a high result."
- If you cannot explain it, say so — an unexplained anomaly honestly reported is better than a deleted one.
Significant figures and units
Excellence requires appropriate significant figures and units.
-
The answer carries the significant figures of the least precise measurement.
-
In a typical titration that is the pipetted aliquot at 3 sf.
-
Exact numbers — dilution factors, mole ratios — do not limit precision.
-
Carry unrounded values through and round once, at the end.
-
Every quantity gets a unit, written with a negative index: mol L−1, g mol−1, mg L−1.
-
Reporting a concentration to seven digits from a burette read to ±0.05 mL is a stated Excellence criterion failed, however good the chemistry.
The conclusion
Merit requires the conclusion to link the processed data to the purpose. A complete conclusion:
- States the trend in terms of the variables investigated, with numbers.
- Answers the purpose directly.
- Says how strong the evidence is — how many points, how consistent, how large the change compared with the scatter.
Worked ExampleProcessing one data point in a trend
In an investigation of how the ascorbic acid concentration of orange juice changes with storage, the day-4 sample gave titres of 19.05, 18.60, 18.65 and 18.55 mL against 0.0104 mol L−1 iodine solution. A 25.0 mL aliquot of juice was used, undiluted.
Process this data point. (M(C6H8O6) = 176.14 g mol−1; C6H8O6 + I2 → C6H6O6 + 2HI)
Step 1 — Identify the concordant titres
The first titration, 19.05 mL, is the rough titration and is excluded — it is high, as rough titrations usually are.
The remaining three are 18.60, 18.65 and 18.55 mL. The largest difference is mL, so these agree within the 0.1 mL tolerance and are concordant.
Step 2 — Mean titre
Step 3 — Moles of iodine
Step 4 — Moles of ascorbic acid
The equation gives a 1 : 1 ratio:
Step 5 — Concentration in the juice
The aliquot was 25.0 mL = 0.0250 L, undiluted:
Step 6 — Convert to the units the trend uses
Vitamin C is conventionally reported in mg per 100 mL:
Working it through directly: 1.36288 g in 1 L is 136.288 mg per 100 mL... more carefully, , and per 100 mL that is:
Step 7 — Significant figures
The measurements are the titre (18.60 mL, 4 sf), the iodine concentration (0.0104 mol L−1, 3 sf) and the aliquot (25.0 mL, 3 sf). The limiting precision is 3 significant figures.
Step 8 — Sanity check
Fresh orange juice contains roughly 30–60 mg of vitamin C per 100 mL. A value of 136 mg per 100 mL is well above that — which is worth flagging in the report rather than accepting silently. Possible explanations include the juice being fortified with added ascorbic acid, or interference from other reducing substances in the juice that also react with iodine, which would make the result high.
Answer: 7.74 × 10⁻³ mol L−1, or 136 mg per 100 mL — a value high enough to warrant comment in the evaluation.