Comparison questions and describing the samples
Posing a comparison question
-
A comparison investigative question must name:
- the two groups being compared
- the variable being measured
- the populations the samples come from.
-
A good question:
- "I wonder whether the median weekly grocery spend of one-person households tends to be lower than that of two-person households, for New Zealand households in the year this survey was taken?"
-
The words "tends to" matter. You are asking about a general tendency in the populations, not about which sample happens to be higher — you can see that by looking.
-
Weak questions and why they fail:
- "Is the median spend of one-person households lower?" — describes the sample, not the population; you can answer it by looking, so it is not an inference question.
- "Do one-person households spend less?" — no variable specified, no population.
- "Which group is better?" — not a statistical question.
Describing the sample distributions
- Use a box plot with the raw data (a dot plot) overlaid for each group, on the same scale. This is the standard display, and it lets you see shape and spread as well as centre.
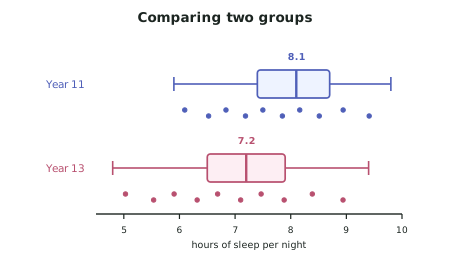
- Describe five things for each group, and compare them:
| Feature | What to say |
|---|---|
| Centre | The medians, with values and units |
| Spread | The interquartile ranges, with values |
| Shape | Symmetric, right-skewed, left-skewed |
| Overlap | How much the two distributions overlap |
| Unusual features | Outliers, gaps, clusters |
- Quote the numbers. "The median for two-person households is $218, compared with $142 for one-person households — a difference of $76." That sentence carries evidence; "group B is higher" does not.
Why the median, not the mean
- The NZ approach at this level compares medians, and there are good reasons worth stating:
- The median is resistant to outliers, so a single extreme value does not distort it.
- Many real variables — income, spend, waiting time — are right-skewed, and the median describes a typical value better than the mean for skewed data.
- Say which you used and why. It is a small piece of justification that demonstrates understanding.
Discussing overlap
- Overlap is the key idea in this standard, and it is what determines whether a call can be made.
- Two distributions that barely overlap give strong evidence of a difference. Two that overlap heavily give weak evidence, even if the medians differ.
- Describe it in words with reference to the plot: "the two distributions overlap substantially — the middle 50% of the one-person group ($105 to $180) sits almost entirely inside the range of the two-person group."
Sampling variability — the idea the standard is built on
- Your medians are estimates. A different random sample from the same populations would have given different medians.
- Sampling variability is that variation, and it is why you cannot conclude anything about the populations just by comparing two sample medians.
- Two things reduce it, and both are worth mentioning:
- Larger samples give estimates that vary less.
- Less variable populations give estimates that vary less.
- This is exactly why a formal inference is needed. Without it, you cannot tell whether a difference between two sample medians reflects a real difference between the populations or just the luck of which individuals were sampled.
Worked ExamplePosing the question and describing the samples
A student is given a data set of New Zealand secondary students with variables including year level, weekly hours of screen time outside school, hours of sleep per night, gender, and whether the student plays a school sport.
She takes a random sample of 40 Year 11 students and 40 Year 13 students and compares hours of sleep per night.
Sample statistics:
| Year 11 | Year 13 | |
|---|---|---|
| Median | 8.1 h | 7.2 h |
| Lower quartile | 7.4 h | 6.5 h |
| Upper quartile | 8.7 h | 7.9 h |
| IQR | 1.3 h | 1.4 h |
| Minimum | 5.9 h | 4.8 h |
| Maximum | 9.8 h | 9.4 h |
Both distributions are roughly symmetric with a slight left skew.
Write her question and the sample description.
Step 1 — Pose the comparison question
Note the three required parts: two groups (Year 11 and Year 13), the variable (hours of sleep per night), and the populations (New Zealand secondary students in this survey). The phrase "tends to" signals that this is a question about the populations, not about the samples.