The randomisation test and the conclusion
The question a randomisation test answers
- Your experiment produced a difference between the two groups. Before claiming the treatment did it, you must rule out the obvious alternative:
Could a difference this large have arisen purely from the luck of the random allocation, even if the treatment had no effect at all?
- A randomisation test answers exactly that question, and it does so by simulating the experiment as if the treatment did nothing.
How it works
- The logic: if the treatment had no effect, then each unit's result would have been the same whichever group it had been allocated to. The labels "treatment" and "control" would be arbitrary.
- The procedure, carried out by the software:
- Pool all the results, ignoring which group they came from.
- Randomly re-allocate them into two groups of the same sizes as the original.
- Calculate the difference between the two group statistics.
- Repeat — typically 1 000 times or more.
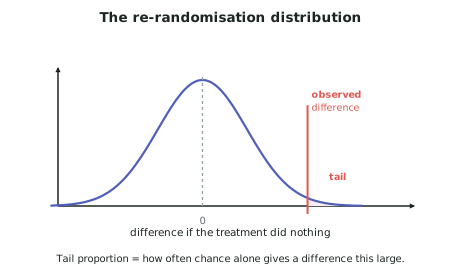
- The 1 000 differences form the re-randomisation distribution: what chance alone produces when the treatment does nothing.
The tail proportion
- Count how many of the re-randomised differences are at least as extreme as the one you actually observed, and divide by the number of repetitions:
- What it means: the proportion of the time chance alone would produce a difference as large as yours, if the treatment did nothing.
Interpreting it
| Tail proportion | Interpretation |
|---|---|
| Large (say above 0.10) | Chance alone readily produces a difference this size — the experiment provides no evidence that the treatment had an effect |
| Small (say below 0.05) | Chance alone rarely produces a difference this size — there is evidence the treatment had an effect |
| In between | Weak or suggestive evidence; say so rather than forcing a verdict |
- These are guidelines, not a rule. The standard asks you to assess the strength of the evidence, not to apply a cut-off. Describe the strength in words and explain what the number means.
Wording the inference
- When the tail proportion is small:
- "Only 12 of the 1 000 re-randomisations produced a difference as large as the 3.4 words observed, giving a tail proportion of 0.012. This means chance alone would produce a difference this large only about 1.2% of the time. There is therefore strong evidence that listening to music with lyrics caused a reduction in the number of words recalled, for the students in this experiment."
- When it is large:
- "312 of the 1 000 re-randomisations produced a difference at least as large as the 0.6 words observed, a tail proportion of 0.312. Chance alone would produce a difference this size about 31% of the time, so the experiment provides no evidence that the treatment had an effect."
Two things to avoid
- Do not say the treatment "had no effect" when the tail proportion is large. Say the experiment provides no evidence of an effect. A real but small effect could easily go undetected with a small experiment.
- Do not say the result is "proved." Say the evidence is strong or weak.
What you can and cannot conclude
- Because you randomly allocated, you can make a causal claim: the treatment caused the difference for the units in this experiment.
- Because you did not randomly select your units from a wider population, you cannot generalise beyond them. A class experiment supports a conclusion about that class, not about all New Zealand students.
- Saying both of these explicitly is one of the clearest signals of understanding available in this standard.
The conclusion
- A conclusion that scores well:
- Answers the investigative question
- Reports the observed difference with summary statistics from both groups
- States the tail proportion and interprets it as strength of evidence
- Makes the causal claim, correctly limited to the units studied
- Reports any issues that arose during the experiment and their likely effect
- Discusses sources of variation and how the design handled them
- Considers other relevant variables and suggests improvements
Worked ExampleAnalysing and concluding
Continuing the music-and-memory experiment. Results:
| Music (n = 16) | Silence (n = 16) | |
|---|---|---|
| Median words recalled | 9.5 | 12.0 |
| Mean | 9.4 | 12.1 |
| IQR | 3.5 | 3.0 |
The observed difference in means is 2.7 words (silence − music). A randomisation test with 1 000 re-randomisations produced 18 differences at least as large as 2.7.
One student's headphones failed part-way through and their data were recorded with a note.
Write the analysis and conclusion.
Step 1 — Describe the results
Step 2 — Carry out and report the randomisation test
Step 3 — Interpret the tail proportion
Step 4 — State the causal claim with its limits
Step 5 — Report the issues that arose
Step 6 — Close the loop on the design
Return to the sources of variation you identified when planning, and say how each one held up in practice. The single most valuable sentence is the one naming what the design could not control:
Then propose the improvement that would test the mechanism, rather than a generic "use more people":
Step 7 — The conclusion
The conclusion pulls the pieces together in a few sentences. It does not restate the whole analysis: