Building an informal confidence interval
Why one sample median is not enough
- Your sample median is a single estimate of the population median. Because of sampling variability, the true value is probably near it, not exactly it.
- Instead of one number, you quote a range of believable values for the population median. That range is the informal confidence interval.
The informal confidence interval
- The interval is centred on the sample median and reaches out an equal amount on each side.
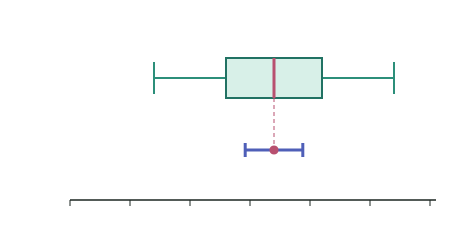
- It gives a range in which the population median is believed to lie.
The formula
- median — the sample median (the centre of the interval).
- IQR — the interquartile range, (the sample's spread).
- — the sample size (how many values you measured).
- — the square root of the sample size. Dividing by it means bigger samples give smaller intervals.
- — a fixed multiplier for this informal method.
Building the interval step by step
- Find the sample median and the IQR ().
- Compute the margin .
- Subtract from the median for the lower end, add for the upper end.
- Write the interval as , in the units of the context.
Worked ExampleAn interval for a population median
A grower weighs a random sample of kiwifruit from Orchard A. The sample has median g, g and g. Build an informal confidence interval for the population median weight.
Step 1 — Find the IQR
Step 2 — Compute the margin
Step 3 — Build the interval
Step 4 — Interpret in context
What the interval means
- It is a range of believable values for the population median, based on this sample.
- It is not about individual values. The interval does not say most kiwifruit weigh between 104 g and 116 g — plenty weigh less than 98 g or more than 122 g. It is a statement about the median of the whole orchard, which is a single fixed number we are trying to locate.
- It is not a guarantee. The method usually captures the population median, but any one interval built from any one sample may miss it.
- A wider interval means more uncertainty about where the population median sits, not more variation in the fruit.
- Say it in context, in full. "It is a believable range for the median weight of all kiwifruit from Orchard A" — naming the population and the variable is what earns the interpretation marks.
Why the formula has the shape it does
Each part of is doing a job, and understanding them makes the formula hard to misuse.
- IQR on the top — the more spread out the data, the less precisely one sample pins down the centre, so a bigger IQR widens the interval.
- on the bottom — a bigger sample gives a more reliable estimate, so more data narrows it.
- The square root, not itself — this is why precision improves slowly. To halve the interval you must quadruple the sample size, not double it.
- The 1.5 is a fixed multiplier chosen so this informal method behaves roughly like the formal intervals used at Level 3.
What makes the interval narrower
- A larger sample ( up) → up → margin down → narrower interval, and a more precise estimate.
- A smaller IQR (less spread in the data) → smaller margin → narrower interval.
- You control one of these and not the other. Sample size is your decision; the spread of the population is a fact about the world, and pretending otherwise by discarding awkward values is not an option.
- Narrow intervals are what let you eventually make the call between two groups — if the two intervals do not overlap, the difference is worth claiming.