Running the simulation and estimating the probability
Running the trials
- Generate the random numbers, read them in groups the size of one trial, and record the result of each trial in a table or tally.
- Keep going until you have reached your planned number of trials — decided in advance, not when the answer starts looking convenient.
- Record every trial as you go, including the ones that produce a boring result. Recording is a named component of the process, and the marker needs to see the raw record, not just the total.
- Do not change the rules part-way through. If you realise the design is wrong, start again and say so in your report — a set of trials run under two different rules estimates nothing.
Describing the distribution of results
- Plotting how often each result happened gives the distribution of the outcome — a bar graph or dot plot.
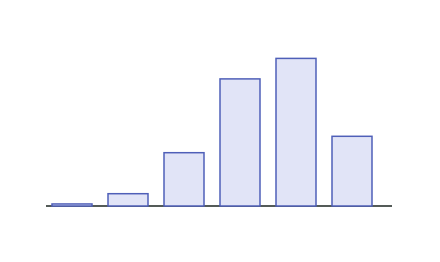
- The standard asks you to select and use appropriate displays and measures, so the distribution needs describing, not just drawing. Cover:
- Centre — the most common result, and the mean or median number of successes
- Spread — the range of results that actually occurred
- Shape — is it symmetric, or does it lean to one side?
- Unusual features — results that almost never happened, or gaps
- Read the picture in context. Here, most trials of 5 shots give 3 or 4 makes, 0 makes almost never happens, and the distribution leans slightly toward the higher numbers — which is what you would expect from a player who makes most of their shots.
- The distribution answers questions the single estimate cannot, such as how unusual a bad night would be, and it is what turns a number into an interpretation.
Estimating the probability
- The estimate is the relative frequency — how often the event happened out of all trials:
- Count the trials where the event occurred, divide by the total, and state the estimate (as a fraction, decimal or percentage), in context.
- The answer is an estimate, and the wording must say so. "Based on 200 trials, the estimated probability is about 0.53" is right; "the probability is 0.53" claims more than a simulation can deliver.
- A different set of trials would give a slightly different answer. That variation is not a flaw in your work — it is the reason the next page is about how many trials to run.
Worked ExampleEstimating from the results
Using the distribution above (200 trials of 5 free throws), estimate the probability that the player makes at least 4 of 5 shots.
Step 1 — Count the trials with the event
"At least 4 makes" means 4 makes or 5 makes:
Step 2 — Divide by the total