The normal distribution
What the normal distribution is
- A distribution describes how likely different values of a variable are.
- The normal distribution is a symmetric, bell-shaped curve that fits many natural measurements — heights, weights, birth weights, exam marks, the diameter of machine-made parts.
- It is described by exactly two numbers:
- the mean (Greek "mu") — the centre of the bell, where it peaks
- the standard deviation (Greek "sigma") — the spread; a larger gives a wider, flatter bell
- Changing slides the curve along; changing stretches or squashes it. The shape itself never changes.
Why area means probability
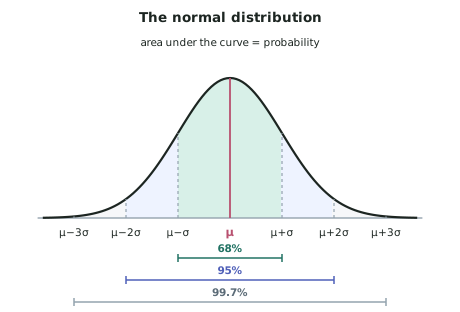
- The total area under the curve is exactly 1, because the variable must take some value.
- An area under part of the curve is the probability of landing in that part. This is the single idea the whole topic rests on — every question is really asking "what fraction of the area is this?"
- Because the curve is symmetric about the mean:
- — half the values lie below the mean
- — and half above
- The 68–95–99.7 rule is worth knowing by heart, because it lets you check any answer at a glance:
- about 68% of values lie within 1 standard deviation of the mean
- about 95% within 2
- about 99.7% within 3
- A value more than 3 standard deviations out is genuinely rare — roughly 3 in 1000 — which is why quality control and medical screening use these cut-offs.
Standardising with the z-score
- A z-score converts any value into the number of standard deviations it sits from the mean:
- Each variable:
- — the value you are interested in
- — the mean of the distribution
- — the standard deviation
- — how many standard deviations is above (positive) or below (negative) the mean
- is exactly at the mean. A positive is above it, a negative below it.
- Why standardise at all? It puts every normal distribution onto one common scale, so a single set of tables — or one calculator function — handles all of them. A height in centimetres and a mark out of 100 both become plain numbers.
- z-scores also let you compare across different distributions. A student who is in Maths and in English did relatively better in Maths, even if the raw marks say otherwise.
The three kinds of question
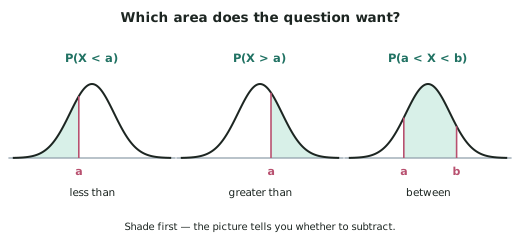
- Less than a value — the area to the left. This is what most calculators give directly.
- Greater than a value — the area to the right. Because the total area is 1:
- Between two values — subtract one area from the other:
- Subtract, never add. You are cutting the smaller left-hand area off the bigger one, leaving the strip in between.
Working backwards: the inverse problem
- An inverse question gives you the probability and asks for the value — "the tallest 10%", "the pass mark that lets 75% through", "the weight only 5% of bags fall below".
- Run the standardising process in reverse:
- Find the z-score matching that area (the inverse normal function on your calculator, often written InvNorm).
- Rearrange the z-score formula to get back:
- Watch which tail the question means. Calculators usually work from the left, so "the top 10%" is the value with 0.90 below it, not 0.10.
- A negative z is expected whenever the answer sits below the mean — the bottom 5% must give a negative z, and a positive one means you used the wrong tail.
Comparing a real data set with the model
- The normal distribution is a model, and real data only ever approximately follows it.
- To judge whether the model fits, compare:
- Shape — is the data roughly symmetric and bell-shaped, or is it skewed with a long tail one side?
- Centre and spread — do the sample mean and standard deviation match the model's and ?
- The 68–95–99.7 rule — does about two-thirds of the real data actually fall within one standard deviation?
- Say where the model fails, not just that it fits. Real measurements often break the model in predictable ways: incomes are strongly right-skewed, and anything that cannot go below zero (times, weights, counts) will be skewed if the mean sits close to zero.
- The model can still be useful when the fit is imperfect — the point is to state the limitation rather than pretend it is not there.
Worked ExampleCalculating a z-score
A normal distribution has mean 50 and standard deviation 10. Find the z-score of the value 65.
Step 1 — Subtract the mean, divide by the standard deviation
Step 2 — Interpret
means the value 65 is 1.5 standard deviations above the mean.
Worked ExampleFinding a probability
The heights of a group of plants are normally distributed with mean cm and standard deviation cm. Find the probability that a plant is taller than 180 cm.
Step 1 — Standardise the value
Step 2 — Sketch and identify the area
We want , the area to the right of .
Step 3 — Read the probability
From a calculator, .
So about 10.6% of plants are taller than 180 cm.
Worked ExampleFinding the probability between two values
The same plants have heights that are normally distributed with cm and cm.
Find the probability that a plant is between cm and cm tall.
Step 1 — Sketch the curve and shade the strip
Mark and on the horizontal axis and shade between them. The mean, , sits inside the shaded strip, so the answer must come out well above 0.5 — worth noting now as a check.
Step 2 — Standardise both ends
Step 3 — Find the area to the left of each end
Step 4 — Subtract to leave only the strip between them
The smaller area is the part below cm, which is not wanted, so take it away:
Step 5 — Check against the sketch
About 74%, comfortably above 0.5 as the sketch predicted, and sensible: the strip runs from one standard deviation below the mean to a little over one above, which the 68% rule says should be roughly this size.
Worked ExampleWorking backwards from a probability
Battery lifetimes are normally distributed with a mean of hours and a standard deviation of hours.
The manufacturer wants to advertise a lifetime that 90% of batteries exceed. Find that lifetime.
Step 1 — Recognise this as an inverse problem
The probability is given () and the value is unknown — so the z-score formula has to be run backwards.
Step 2 — Convert the wording into an area on the LEFT
"90% exceed it" means 90% lie above, so only 10% lie below:
Step 3 — Find the z-score for that area
The z-score is negative, as it must be — a value that only 10% of batteries fall below has to sit below the mean.
Step 4 — Convert the z-score back into hours
Step 5 — Round sensibly for the context