What the intercept tells you
What the intercept tells you
Once a graph is linearised, the intercept is as informative as the gradient — and it is where systematic errors show up.
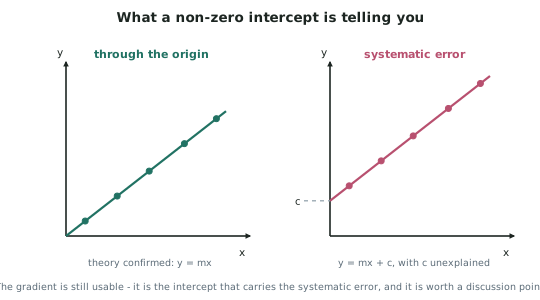
- If the theory predicts (a relationship with no constant term), the linearised graph should pass through the origin.
- A line with the right gradient but a non-zero intercept means every reading has been shifted by the same amount — the signature of a systematic error.
- A random error scatters points around the line. A systematic error moves the whole line. Repeats fix the first and do nothing about the second.
Common causes of an unexpected intercept
| Cause | Effect on the graph |
|---|---|
| An instrument not zeroed | every reading shifted by a constant, so a constant intercept |
| A length measured from the wrong reference point | a constant offset in , shifting the line sideways |
| A background signal (light, sound, count rate) | a constant added to , lifting the line |
| A quantity you assumed was zero but was not (friction, air resistance) | usually a genuine physical intercept, not an error |
Deciding what an intercept means
Work through three questions in order.
- Does the theory predict an intercept? Some relationships genuinely have one — a real spring may have a small tension at zero extension, and a real circuit has the internal resistance of the cell. If the theory predicts one, its value is a result, not an error.
- Is it significant? Compare the intercept with its own uncertainty, found from where the steepest and shallowest lines cross the axis. An intercept of is consistent with zero and needs no explanation.
- If it is significant and unpredicted, what would cause it? Name a mechanism, and state its direction — does it make readings too high or too low?
Why the gradient often survives
- A constant offset in changes the intercept but not the gradient, because it shifts every point by the same amount.
- So a systematic offset usually leaves your relationship and any quantity derived from the gradient intact — while making the graph fail to pass through the origin as theory predicts.
- This is worth stating explicitly in the discussion: it tells the reader that a value of (say) from the gradient is still trustworthy even though the graph missed the origin.
Worked ExampleInterpreting an unexpected intercept
A student investigating the illuminance from a lamp plots against . Theory predicts a straight line through the origin. Their line has gradient lx m2 and an intercept of lx. Interpret this result.
Step 1 — Check whether the intercept is significant
The intercept is lx with an uncertainty of lx, so the range is to lx. Zero is far outside that range, so the intercept is real and needs explaining.
Step 2 — Interpret it physically
The intercept is the value of as , that is, at infinite distance from the lamp. The lamp itself contributes nothing there, so a reading of lx means the meter records lx that does not come from the lamp: background light.
Step 3 — Identify the direction of the error
Background light adds to every reading, so every measured illuminance is too high by about lx. The relationship is really
Step 4 — State the effect on the conclusion
Because the offset is the same at every distance, it changes the intercept but not the gradient. The measured inverse-square shape and the value lx m2 are therefore still valid. What is invalid is the claim that the graph passes through the origin.
Step 5 — Say how to remove it
Record the illuminance with the lamp off and subtract that background from every reading, or repeat in a darkened room. Either would bring the intercept to zero within its uncertainty.