Graphing an inequality and finding the feasible region
Graphing a linear inequality
- An inequality such as describes a whole region of the plane, not a single line.
- Graphing it has two parts:
- Draw the boundary line (the equation with ).
- Shade the side that satisfies the inequality.
Drawing the boundary line
- Replace the inequality sign with to get the boundary: .
- Plot it quickly using the intercepts:
- -intercept: set → , giving .
- -intercept: set → , giving .
- Use a solid line for or (the boundary is included).
- Use a dashed line for or (the boundary is not included). NCEA constraints are almost always or , so lines are solid.
Deciding which side to shade
- Pick a test point not on the line — the origin is easiest when the line does not pass through it.
- Substitute it into the inequality:
- If the statement is true, shade the side containing the test point.
- If it is false, shade the other side.
- For : at , is true, so shade the side with the origin.
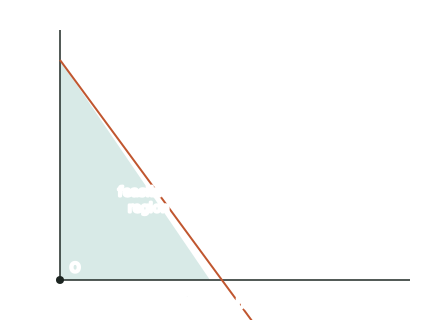
Finding the feasible region
- The feasible region is the set of points that satisfy every constraint at once.
- Graph all the constraint lines on the same axes and shade each one.
- The feasible region is the area where all the shaded regions overlap.
- Tip: shade lightly, or shade the unwanted side out, so the surviving overlap stays clear.
Reading the vertices (corner points)
- The feasible region is a polygon (bounded) or an open shape (unbounded); its corners are the vertices.
- Each vertex is where two boundary lines cross — find it by solving those two equations simultaneously.
- The vertices matter because the optimum always sits at one of them (next page).
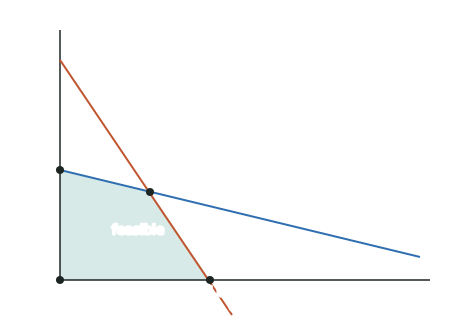
A Rotorua furniture workshop makes tables and chairs. Assembly time gives and timber gives , with . Graph the feasible region and find its vertices.
Step 1 — Draw each boundary by intercepts
For : -intercept , -intercept .
For : -intercept , -intercept .
Step 2 — Shade each constraint
Testing : ✓ and ✓, so both constraints keep the origin side. With the region sits in the first quadrant.
Step 3 — Find the vertex where the two lines cross
Solve and together. From the first, . Substitute:
Then , giving the vertex .
Step 4 — List all vertices
The remaining corners are the axis intercepts inside the region:
Test yourself
Practice by grade
One question each at Achieved, Merit and Excellence. Have a go, then compare with the model answer.
Graphing , a student needs to know which side to shade. Using the test point , decide which side satisfies the inequality and state the two intercepts of the boundary line.
A region is bounded by , , and . Find the coordinates of every vertex of the feasible region.
For the constraints , , , , explain why is not in the feasible region, and find the vertex where meets .