Sampling error and the margin of error
Even a good sample is not exact
- Take a random sample and it still will not match the population exactly — a different random sample would give a slightly different figure. This natural wobble is sampling error.
- It is not a mistake; it is the unavoidable result of measuring a sample instead of everyone.
The margin of error
- A good poll reports a margin of error — how far the true value could reasonably be from the reported figure.
- A result of "45%, margin of error ±3%" means the true value is likely between 42% and 48%.
- Bigger samples give a smaller margin of error, so larger polls pin the figure down more tightly.
Comparing two figures in a poll
- To decide whether a difference or lead is real, check it against the margin of error.
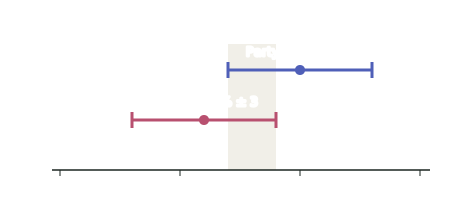
- If the two figures' intervals overlap, the difference is within the margin of error — it could just be sampling error, so it is too close to call.
- Only when the gap is bigger than the margin is a lead reasonably real.
A poll of 1,000 voters reports Party A on 45% and Party B on 41%, with a margin of error of ±3%. A headline says "Party A takes the lead." Evaluate the headline.
Step 1 — Build each interval
- Party A: true value likely between 42% and 48%.
- Party B: true value likely between 38% and 44%.
Step 2 — Check for overlap
The intervals overlap between 42% and 44% — so Party B's true support could be as high as 44% and Party A's as low as 42%.
Step 3 — Evaluate the headline
Test yourself
Practice by grade
One question each at Achieved, Merit and Excellence. Have a go, then compare with the model answer.
A survey reports 60% support, margin of error ±4%. Between which two values is the true level of support likely to lie?
Option X polls 52% and option Y 48%, margin of error ±3%. Explain whether the report can claim X is more popular.
A report claims a party 'surged' from 40% (±3%) last month to 44% (±3%) this month. Evaluate the claim and explain what would make a change convincing.