The market model: your default tool
Why this model
- No standard in Level 2 Economics names the ordinary market supply and demand model — but it is the right tool for AS91228, because most special-interest issues are about who gets a scarce resource in one market.
- The standard says models are "determined by the special interest issue chosen", and for a single-market allocation problem, this is the model that fits.
Reading it
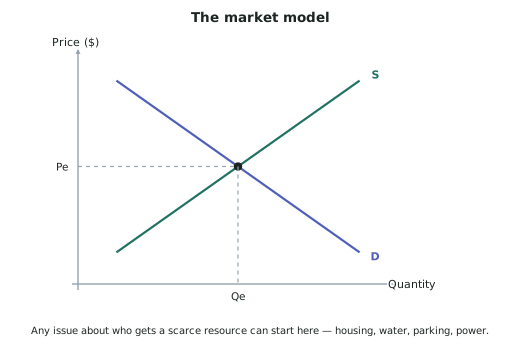
- Vertical axis: the price of the good — rent, the wage, the charge, the fare.
- Horizontal axis: the quantity traded.
- Demand (D) slopes down: at a higher price, buyers want less.
- Supply (S) slopes up: at a higher price, sellers offer more.
- They cross at equilibrium price Pe and equilibrium quantity Qe.
Equilibrium is the allocation. The price is what decides who gets the scarce resource — everyone willing to pay Pe gets it, and everyone not willing to pay Pe does not. That is why this model answers a resource-allocation question.
What shifts demand
| Cause | Direction |
|---|---|
| More buyers — population growth, migration | Right |
| Higher incomes (for a normal good) | Right |
| The price of a substitute rises | Right |
| The price of a complement rises | Left |
| Tastes or preferences change toward it | Right |
| Expectations of future price rises | Right |
What shifts supply
| Cause | Direction |
|---|---|
| Costs of production fall | Right |
| Costs of production rise | Left |
| New technology raises productivity | Right |
| More producers enter | Right |
| A regulation restricts what can be produced | Left |
| A natural event destroys output | Left |
The four outcomes — learn the pattern
| Shift | Price | Quantity |
|---|---|---|
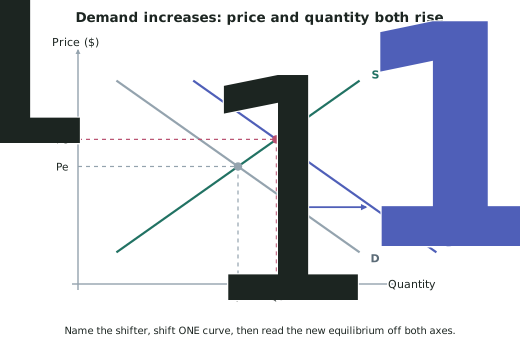
| Demand right | Rises | Rises |
| Demand left | Falls | Falls |
| Supply right | Falls | Rises |
| Supply left | Rises | Falls |
- Demand shifts move price and quantity the same way. Supply shifts move them opposite ways.
- This is the same pattern as AD and AS on the macro model, for the same reason.
Elasticity — why some shortages are so severe
- How much the price rises depends on how responsive the other curve is.
- Inelastic supply — supply that cannot easily expand — means a rightward shift of demand produces a large price rise and only a small quantity rise.
- This is why housing, road space and water produce such severe issues: their supply takes years to expand, or cannot expand at all.
- Saying this explicitly is one of the most valuable things you can write, because it explains the severity of your issue, not just its direction.
Other models you may need
| If your issue is about… | Use |
|---|---|
| A shortage of workers or skills | Labour market S & D |
| A price cap or floor | Market S & D with a horizontal price line |
| A tax, levy or charge | Market S & D with the price to the buyer raised |
| A quota or limit | Market S & D with supply fixed at the limit |
| Something affecting the whole economy | AS/AD, circular flow, PPF |
| Something traded internationally | Price taker or two-country model |
Worked ExampleApplying the market model to an issue
⚠️ Illustrative issue and invented figures, for method only.
In a growing New Zealand city, the population has risen sharply through internal migration and immigration. Building consents have been slow and construction costs have risen. Average weekly rent has risen from an illustrative $480 to $620 over three years, while the number of rental dwellings has risen only slightly.
Use the market model to explain what has happened.
Step 1 — Define the market
- The good: rental dwellings in this city.
- Buyers: households seeking to rent.
- Sellers: landlords offering dwellings.
- Price: weekly rent ($) — the vertical axis.
- Quantity: number of rental dwellings rented — the horizontal axis.
Step 2 — Identify the demand-side change and shift the curve
The shifter: population growth. Internal migration and immigration have increased the number of households wanting to rent in this city, and household formation has added more.
More buyers at every price means demand shifts right, from D to D1.
Step 3 — Identify the supply-side change
The shifter: slow consenting and higher construction costs mean fewer dwellings are being added than would otherwise be, so supply has not shifted right by much — and higher building costs may have shifted it slightly left.
Critically, supply is highly inelastic in the short run: a dwelling takes years to consent, finance and build, so the number available this year is close to fixed regardless of the rent.
Step 4 — Read the new equilibrium
D1 cuts the near-vertical supply curve much higher up:
- Rent rises from Pe (620) — a rise of about 29%.
- Quantity rises only slightly, from Qe to Qe1.
Step 5 — Explain why the price rise is so large
This is the analytical step.
If supply were elastic — if dwellings could be built quickly and cheaply — the rightward shift of demand would be met mostly by more dwellings, and rent would rise only a little.
Because supply is inelastic, the extra demand cannot be met with extra quantity. The only way the market can clear is by rationing the existing dwellings by price: rent rises until enough households are priced out that the quantity demanded matches the fixed quantity available.
So the severity of the issue comes from the supply side, even though the trigger came from the demand side.
Step 6 — State the allocation outcome
The scarce resource — dwellings in this city — is now allocated to households willing and able to pay $620. Households that cannot are allocated out of the market: they move further away, share, or leave the city.