Reciprocal functions and properties of trigonometric graphs
The three reciprocal functions
- Each is one divided by one of the familiar functions:
- The pairing is deliberately counterintuitive:
- sec goes with cos (not sin)
- cosec goes with sin (not cos)
- cot goes with tan
- The memory aid: look at the third letter. Sec → cos; cosec → sin... more reliably, remember that the "co" in cosec pairs it with the function without a "co".
Where they are undefined
- A reciprocal is undefined wherever its partner is zero.
- is undefined where , at
- is undefined where , at
- is undefined where , at
- These are vertical asymptotes on the graphs, and they must be marked on any sketch.
Their ranges
- Since and , taking reciprocals gives:
- So and never take values strictly between and . An equation such as has no solution, and recognising that immediately saves wasted work.
- has no such restriction — its range is all real numbers, like .
The shape of the basic graphs
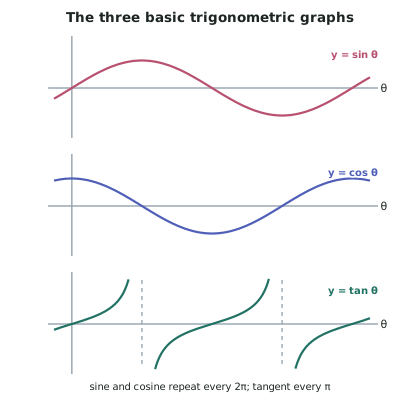
| Function | Period | Range | Asymptotes |
|---|---|---|---|
| none | |||
| none | |||
| all real | |||
| all real |
- Note that tangent and cotangent have period , not . This matters enormously when solving equations — a tangent equation has solutions spaced apart, not .
Transformations
-
For :
- — the amplitude, half the distance from minimum to maximum
- — affects the period: new period
- — the horizontal shift (phase shift), right by
- — the vertical shift, up by
-
The period formula is the one to be careful with. has period — a larger means a shorter period, because the graph is squashed horizontally.
-
For tangent, the period is , since the parent period is .
-
Worked through — :
- Amplitude 4, so the curve swings 4 either side of its centre line
- Period
- Centre line at , so the range is
Symmetry properties
- Even and odd behaviour is worth knowing because it appears in identity work:
- Shift relationships, which explain why sine and cosine look identical apart from position:
Modelling with trigonometric functions
- Anything periodic can be modelled this way — tides, daylight hours, temperature cycles, a Ferris wheel.
- Build the model from the features:
- Amplitude
- Vertical shift — the centre line
- from the period:
- from where the cycle starts
Worked ExampleBuilding a periodic model
The depth of water in a harbour varies between a maximum of 8.4 m and a minimum of 2.6 m. High tide occurs at 3:00 am and the next high tide is at 3:24 pm. Write a model for the depth metres at time hours after midnight, and find the depth at 9:00 am.
Step 1 — Find the amplitude
The amplitude is half the total swing:
Step 2 — Find the vertical shift
The centre line sits midway between the extremes:
Check: ✓ and ✓
Step 3 — Find the period
High tide is at 3:00 am () and the next at 3:24 pm (, since 3:24 pm is 15 hours and 24 minutes after midnight, and ).
Step 4 — Find
Step 5 — Choose the function and the phase shift
A cosine is the natural choice here, because cosine starts at its maximum — and we know exactly when a maximum occurs.
with being the time of a maximum, so .
Step 6 — Write the model
Step 7 — Check the model at the known points
At (high tide):
At (next high tide): the argument is , so
At low tide, half a period after high tide, :
Step 8 — Find the depth at 9:00 am
:
Working in radians:
Step 9 — Sense-check
9:00 am is very close to the low-tide time of 9:12 am (), so the depth should be barely above the minimum of 2.6 m — and 2.615 m is exactly that ✓
A note on the model's limits. Real tides are not perfectly sinusoidal — they are affected by weather, barometric pressure and coastal geography — so this model gives a good approximation rather than an exact prediction, and it assumes every cycle is identical.