Sampling error and the margin of error
Even a good sample is not exact
- Take a random sample and it still will not match the population exactly — a different random sample would give a slightly different figure. This natural wobble is sampling error.
- It is not a mistake; it is the unavoidable result of measuring a sample instead of everyone.
The margin of error
- A good poll reports a margin of error — how far the true value could reasonably be from the reported figure.
- A result of "45%, margin of error ±3%" means the true value is likely between 42% and 48%.
- Bigger samples give a smaller margin of error, so larger polls pin the figure down more tightly.
Comparing two figures in a poll
- To decide whether a difference or lead is real, check it against the margin of error.
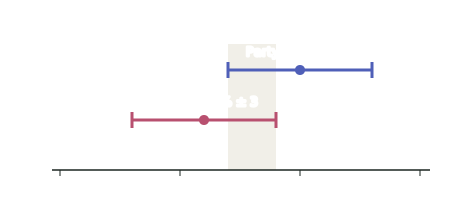
- If the two figures' intervals overlap, the difference is within the margin of error — it could just be sampling error, so it is too close to call.
- Only when the gap is bigger than the margin is a lead reasonably real.
What the margin of error does NOT cover
This is the single most examined idea in this standard, and the one most reports get wrong.
- The margin of error covers sampling error only — the fact that a different random sample would have given a slightly different figure.
- It makes no allowance whatever for non-sampling errors, including:
- undercoverage — part of the population had no chance of being included (a landline-only poll misses younger voters entirely)
- non-response — the people who refused may differ systematically from those who answered
- question wording — a leading or ambiguous question biases every response
- untruthful answers — especially on sensitive topics
- processing mistakes — data entered or coded wrongly
- So "±3%" is an honest statement about one source of error and silence about five others. A poll with a 20% response rate can quote a small margin of error and still be badly wrong.
- Naming a specific non-sampling error in the report you are evaluating — and saying which way it would bias the result — is the clearest route to the top grade in this standard.
Why bigger samples help less than you would think
- Precision improves with the square root of the sample size, not in proportion to it.
- roughly, gives about ; gives about ; gives about
- to halve the margin of error you must quadruple the sample
- This is why national polls stop at about 1000 people. Doubling to 2000 costs twice as much and improves the margin by about one percentage point — a deliberate trade-off, not carelessness.
- The size of the population is irrelevant. A sample of 1000 gives the same margin of error whether the population is 100,000 or 5 million. A report complaining that "only 1000 people out of 5 million were asked" is making a mistake you can name.
Worked ExampleInterpreting a poll
A poll of 1,000 voters reports Party A on 45% and Party B on 41%, with a margin of error of ±3%. A headline says "Party A takes the lead." Evaluate the headline.
Step 1 — Build each interval
- Party A: true value likely between 42% and 48%.
- Party B: true value likely between 38% and 44%.
Step 2 — Check for overlap
The intervals overlap between 42% and 44% — so Party B's true support could be as high as 44% and Party A's as low as 42%.