Comparing the two groups
Display both groups together
- Once the data is collected, draw the treatment and control groups on the same scale — dot plots, or box plots, one above the other.
- Compare the centre, spread, shape and overlap, just as for any two distributions.
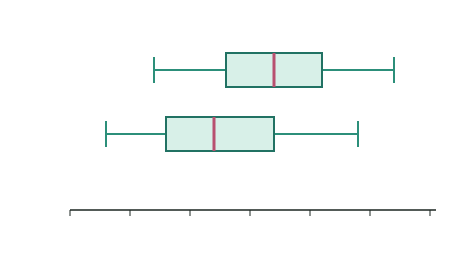
Read the two box plots as the treatment group and the control group.
The observed difference
- The single number that captures the effect is the observed difference between the groups — usually the difference in medians (or means):
- Example: if the treatment median is 12 and the control median is 8, the observed difference is .
- A positive difference suggests the treatment raised the response; a difference near 0 suggests little effect.
The key question
- The treatment group scored higher — but is that because the treatment worked, or just because the random split happened to put the higher units in the treatment group?
- The random allocation itself creates some difference even when the treatment does nothing.
- So before claiming an effect, you must check: is the observed difference bigger than the random split alone would usually produce? That is what re-randomisation answers.
Test yourself
Practice by grade
One question each at Achieved, Merit and Excellence. Have a go, then compare with the model answer.
Achieved
In an experiment, the treatment group's median yield is 15 kg and the control group's is 11 kg. State the observed difference.
Merit
The treatment group has median 15 kg (box 12–18) and the control 11 kg (box 9–14), on the same scale. Compare the groups and state what still needs checking.
Excellence
Two students look at the same experiment. One says 'the treatment clearly works because its median is higher.' Explain why that reasoning is incomplete.